

Heart of Texas Region
The Heart of Texas Region has vibrant economic and workforce diversity!
The Heart of Texas Economic Development District is comprised of six counties in central Texas between Dallas and Austin. The U.S. Census reported the estimated 2019 population to be 372,588, compared to 349,273 in 2010, an increase of nearly 7%. The Region includes six counties, including Bosque, Falls, Freestone, Hill, Limestone and McLennan County. Major population centers are Waco, Hewitt, Robinson and Hillsboro.
Economy
The Heart of Texas Region is heavily agricultural, but its economy is largely driven by the strong industrial and commercial center in the Waco MSA. Smaller centers can be found in Hillsboro and Mexia. Access to health care is generally good throughout the region, with two major health centers in McLennan County and rural health centers in each of the other counties. Economic development in the Heart of Texas region centers around key industry clusters identified in the Texas Industry Cluster Initiative, such as:
- Advanced Technologies and Manufacturing
- Aerospace and Defense
- Energy
Energy production is one of the most significant industrial sectors represented in the Heart of Texas region. Lignite coal, found in Limestone and Freestone counties, is the only significant mineral resource in the area. There is a significant amount of oil and natural gas extraction as well. But recent years have resulted in a trend to develop solar and wind farms around the area. The state of Texas was the second-largest state in the country in solar capacity additions and the rising trend continues today.
Recently, the region has experienced significant economic growth, primarily in the Waco MSA, with several investments by companies like Amazon, Hello Bella, OCI Solar Power and Hecate Energy and can easily accommodate more growth in the coming years.
Workforce
There is an available and skilled workforce in the Heart of Texas region. In November 2020, the Waco MSA had a total employment of 121,023, down nearly 2% from November 2019 as a response to the COVID-19 pandemic. Further wage and employment information for the Waco MSA is illustrated below.
Wages by Industry (millions) (2nd Quarter 2020)
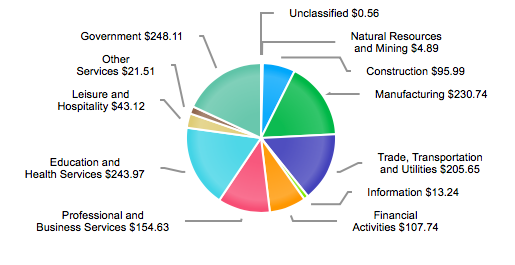
Source: Texas Workforce Commission 12/2020
Employment by Industry (November 2020)
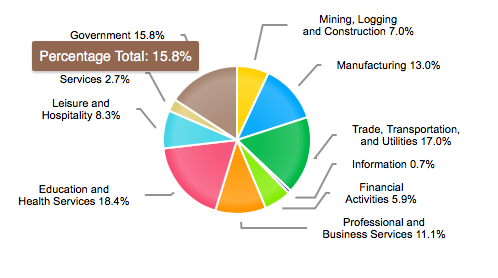
Source: Texas Workforce Commission 12/2020
One of the most significant advantages is the presence of robust workforce training providers, that can all quickly deliver specialized training. Waco is also home to Baylor University, the 11th-largest Christian university in the country and offers a wide range of degree programs for those seeking higher levels of education.
Technical Colleges and Workforce Centers
- Hill College
- McLennan Community College
- Navarro College
- Temple College
- Texas State Technical College
- McLennan County Workforce Solutions Center
Geography
The geography of the Heart of Texas Region is a combination of tablelands and irregular plains ranging to hilly in the west, with altitudes varying from 209 to 1,200 feet above sea level. The mean minimum temperature is 33.3 F and the mean maximum temperature is approximately 96 F. Rainfall averages about 36.21 inches a year. The area has abundant lakes, rivers and streams that are popular for recreation and help provide municipal water supplies.
Population
Population
| Population | 2000 | 2010 | 2023 | 2028 |
|---|---|---|---|---|
| Heart of Texas Region | 320,435 | 348,069 | 380,901 | 388,235 |
Source: ESRI, 2023-10-17
Population by Age
| Population | 2023 |
|---|---|
| 0-4 | 22,681 |
| 5-9 | 23,773 |
| 10-14 | 23,705 |
| 15-19 | 26,066 |
| 20-24 | 31,041 |
| 25-29 | 25,548 |
| 30-34 | 25,213 |
| 35-39 | 23,496 |
| 40-44 | 22,264 |
| 45-49 | 19,848 |
| 50-54 | 20,576 |
| 55-59 | 22,385 |
| 60-64 | 23,635 |
| 65-69 | 22,082 |
| 70-74 | 18,638 |
| 75-79 | 13,194 |
| 80-84 | 8,586 |
| 85+ | 8,169 |
| 18+ | 296,763 |
| Median Age | 38 |
Source: ESRI, 2023-10-17
Population by Race
| Heart of Texas Region | 2023 |
|---|---|
| Total | 380,901.00 |
| White Alone | 60.96% |
| Black Alone | 14.24% |
| American Indian Alone | 0.94% |
| Asian Alone | 1.66% |
| Pacific Islander Alone | 0.07% |
| Some Other Race | 10.82% |
| Two or More Races | 11.32% |
| Hispanic Origin | 25.43% |
| Diversity Index | 74.10 |
Source: ESRI, 2023-10-17
Back To TopHousing
Households
| Population | 2000 | 2010 | 2023 | 2028 |
|---|---|---|---|---|
| Households | 118,361 | 128,971 | 142,729 | 146,628 |
| Housing Units | 133,051 | 147,771 | 162,299 | 166,042 |
| Owner Occupied Units | 93,187 | 96,161 | ||
| Renter Occupied Units | 49,542 | 50,467 | ||
| Vacant Units | 19,570 | 19,414 |
Source: ESRI, 2023-10-17
Home Value
| Heart of Texas Region | 2023 | 2028 |
|---|---|---|
| Median Home Value | $195,262 | $254,086 |
| Average Home Value | $241,125 | $295,579 |
| <$50,000 | 8,451 | 5,712 |
| $50,000 - $99,999 | 13,310 | 8,507 |
| $100,000 - $149,999 | 11,658 | 7,117 |
| $150,000 - $199,999 | 14,546 | 11,843 |
| $200,000 - $249,999 | 12,167 | 13,897 |
| $250,000 - $299,999 | 9,196 | 12,211 |
| $300,000 - $399,999 | 11,206 | 17,254 |
| $400,000 - $499,999 | 4,901 | 7,960 |
| $500,000 - $749,999 | 5,764 | 8,939 |
| $1,000,000 + | 228 | 340 |
Source: ESRI, 2023-10-17
Housing Year Built
| Year Range | Houses Built |
|---|---|
| 2010 or Later | 14,773 |
| 2000-2009 | 19,476 |
| 1990-1999 | 19,988 |
| 1980-1989 | 24,390 |
| 1970-1979 | 25,751 |
| 1960-1969 | 17,232 |
| 1950-1959 | 18,383 |
| 1940-1949 | 6,977 |
| 1939 or Before | 9,565 |
Source: ESRI, 2023-10-17
Back To TopIncome
Income
| Heart of Texas Region | 2023 | 2028 |
|---|---|---|
| Median Household | $58,110 | $65,089 |
| Average Household | $85,503 | $96,679 |
| Per Capita | $32,159 | $36,631 |
Source: ESRI, 2023-10-17
Household Income
| Heart of Texas Region | 2023 |
|---|---|
| <$15,000 | 14,741 |
| $15,000 - $24,999 | 13,387 |
| $25,000 - $34,999 | 14,908 |
| $35,000 - $49,999 | 17,296 |
| $50,000 - $74,999 | 26,485 |
| $75,000 - $99,999 | 16,672 |
| $100,000 - $149,999 | 20,079 |
| $150,000 - $199,999 | 11,319 |
| $200,000+ | 7,842 |
Source: ESRI, 2023-10-17
Back To TopEmployees
Commute
| Category | Commuters |
|---|---|
| Workers 16+ | 159,899 |
| In-County Residents | 132,049 |
| Out-of-County Residents | 26,937 |
| Drive Alone | 131,609 |
| Carpooled | 14,465 |
| Public Transport | 656 |
| Work at Home | 8,728 |
| Motorcycle | 123 |
| Bicycle | 177 |
| Walked | 2,836 |
| Other | 1,238 |
| Less than 5 minutes | 5,959 |
| 5-9 minutes | 19,216 |
| 10-14 minutes | 24,348 |
| 15-19 minutes | 31,674 |
| 20-24 minutes | 22,094 |
| 25-29 minutes | 9,699 |
| 30-34 minutes | 15,717 |
| 35-39 minutes | 3,275 |
| 40-44 minutes | 3,098 |
| 45-59 minutes | 7,024 |
| 60-89 minutes | 4,749 |
| 90+ minutes | 4,319 |
| Average Travel Time | 0 |
Source: ESRI, 2023-10-17
Source: ESRI, 2023-10-17
Employees by NAICS
| Category | Number |
|---|---|
| Total Employees | 157,763 |
| Agr/Forestry/Fish/Hunt | 980 |
| Mining | 399 |
| Utilities | 916 |
| Construction | 9,303 |
| Manufacturing | 10,233 |
| Wholesale Trade | 7,990 |
| Retail Trade | 19,110 |
| Motor Veh/Parts Dealers | 2,722 |
| Furn & Home Furnish Str | 644 |
| Electronics & Appl Store | 428 |
| Bldg Matl/Garden Equip | 1,340 |
| Food & Beverage Stores | 2,987 |
| Health/Pers Care Stores | 1,140 |
| Gasoline Stations | 1,035 |
| Clothing/Accessory Store | 1,063 |
| Sports/Hobby/Book/Music | 2,587 |
| General Merchandise Str | 5,163 |
| Transportation/Warehouse | 3,935 |
| Information | 2,824 |
| Finance & Insurance | 5,915 |
| Cntrl Bank/Crdt Intrmdtn | 3,054 |
| Sec/Cmdty Cntrct/Oth Inv | 635 |
| Insur/Funds/Trusts/Other | 2,226 |
| Real Estate/Rent/Leasing | 2,726 |
| Prof/Scientific/Tech Srv | 8,104 |
| Legal Services | 1,164 |
| Mgmt of Comp/Enterprises | 418 |
| Admin/Support/Waste Mgmt | 2,521 |
| Educational Services | 18,272 |
| HealthCare/Social Assist | 23,359 |
| Arts/Entertainment/Rec | 2,575 |
| Accommodation/Food Srvcs | 14,658 |
| Accommodation | 1,548 |
| Food Srv/Drinking Places | 13,109 |
| Other Srv excl Pub Admin | 9,068 |
| Auto Repair/Maintenance | 1,355 |
| Public Administration Emp | 13,892 |
Source: ESRI, 2023-10-17
Educational Attainment (25+)
| Heart of Texas Region | 2023 |
|---|---|
| <9th Grade | 12,316 |
| Some High School | 19,307 |
| GED | 14,144 |
| Graduated High School | 62,812 |
| Some College/No Degree | 51,787 |
| Associates Degree | 28,021 |
| Bachelor's Degree | 42,525 |
| Graduate Degree | 22,721 |
Source: ESRI, 2023-10-17
Back To TopBusinesses
Businesses by NAICS
| Category | Number |
|---|---|
| Total Businesses | 12,685 |
| Agr/Forestry/Fish/Hunt Bus | 119 |
| Mining Bus | 33 |
| Utilities Bus | 74 |
| Construction Bus | 819 |
| Manufacturing Bus | 399 |
| Wholesale Trade Bus | 455 |
| Retail Trade Bus | 1,881 |
| Motor Veh/Parts Dealers Bus | 309 |
| Furn & Home Furnish Str Bus | 92 |
| Electronics & Appl Store Bus | 46 |
| Bldg Matl/Garden Equip Bus | 136 |
| Food & Beverage Stores Bus | 311 |
| Health/Pers Care Stores Bus | 142 |
| Gasoline Stations Bus | 126 |
| Clothing/Accessory Store Bus | 189 |
| Sports/Hobby/Book/Music Bus | 298 |
| General Merchandise Str Bus | 232 |
| Transportation/Warehouse Bus | 289 |
| Information Bus | 219 |
| Finance & Insurance Bus | 777 |
| Cntrl Bank/Crdt Intrmdtn Bus | 336 |
| Sec/Cmdty Cntrct/Oth Inv Bus | 142 |
| Insur/Funds/Trusts/Other Bus | 299 |
| Real Estate/Rent/Leasing Bus | 596 |
| Prof/Scientific/Tech Srv Bus | 863 |
| Legal Services Bus | 232 |
| Mgmt of Comp/Enterprises Bus | 41 |
| Admin/Support/Waste Mgmt Bus | 339 |
| Educational Services Bus | 403 |
| HealthCare/Social Assist Bus | 995 |
| Arts/Entertainment/Rec Bus | 237 |
| Accommodation/Food Srvcs Bus | 1,064 |
| Accommodation Bus | 173 |
| Food Srv/Drinking Places Bus | 891 |
| Other Srv excl Pub Admin Bus | 1,684 |
| Auto Repair/Maintenance Bus | 299 |
| Public Administration Bus | 649 |
Source: ESRI, 2023-10-17
Back To Top